Measuring Programmer Influence, Kinda Sorta
But remember Goodhart's Law

Disclaimer—any incentives attached to the data about to be discussed renders all future data NULL & VOID & all decisions based on that future data similarly NULL & VOID. I don’t expect this disclaimer will help but not including it is professional malpractice.
Can we use data to figure out who among a large team contributes most?
No, if what we are looking for is a reliable, definitive answer. Data, however, may give us hints of pockets of certain kinds of impact resulting from certain kinds of behavior.
If this answer is unsatisfying to you because you need to, for example, stack rank members of a team, the bottom 20% of whom will be fired, well, bless your heart for having a really tough job. Data won’t shield you from responsibility.
Also, as the disclaimer states, the first time you fire (or promote or give bonuses) based on this data is the last time this data will be reliable. This is my last warning. This post. JK.
The data that follows is taken from the React project, but replicates for all the projects I’ve looked at. If you find data with a distinctly different shape I’d love to hear about it. The scripts will work on any Git repository.
Thanks to this week’s sponsor, Screenshot Bot. Arnold Noronha, the founder, was a student of mine at Facebook.
Screenshot tests for mobile apps (and more)
Want to know when something has accidentally changed in your mobile app? Screenshot tests occupy a unique point in the space of tests—easy to write, predictive, & automated.
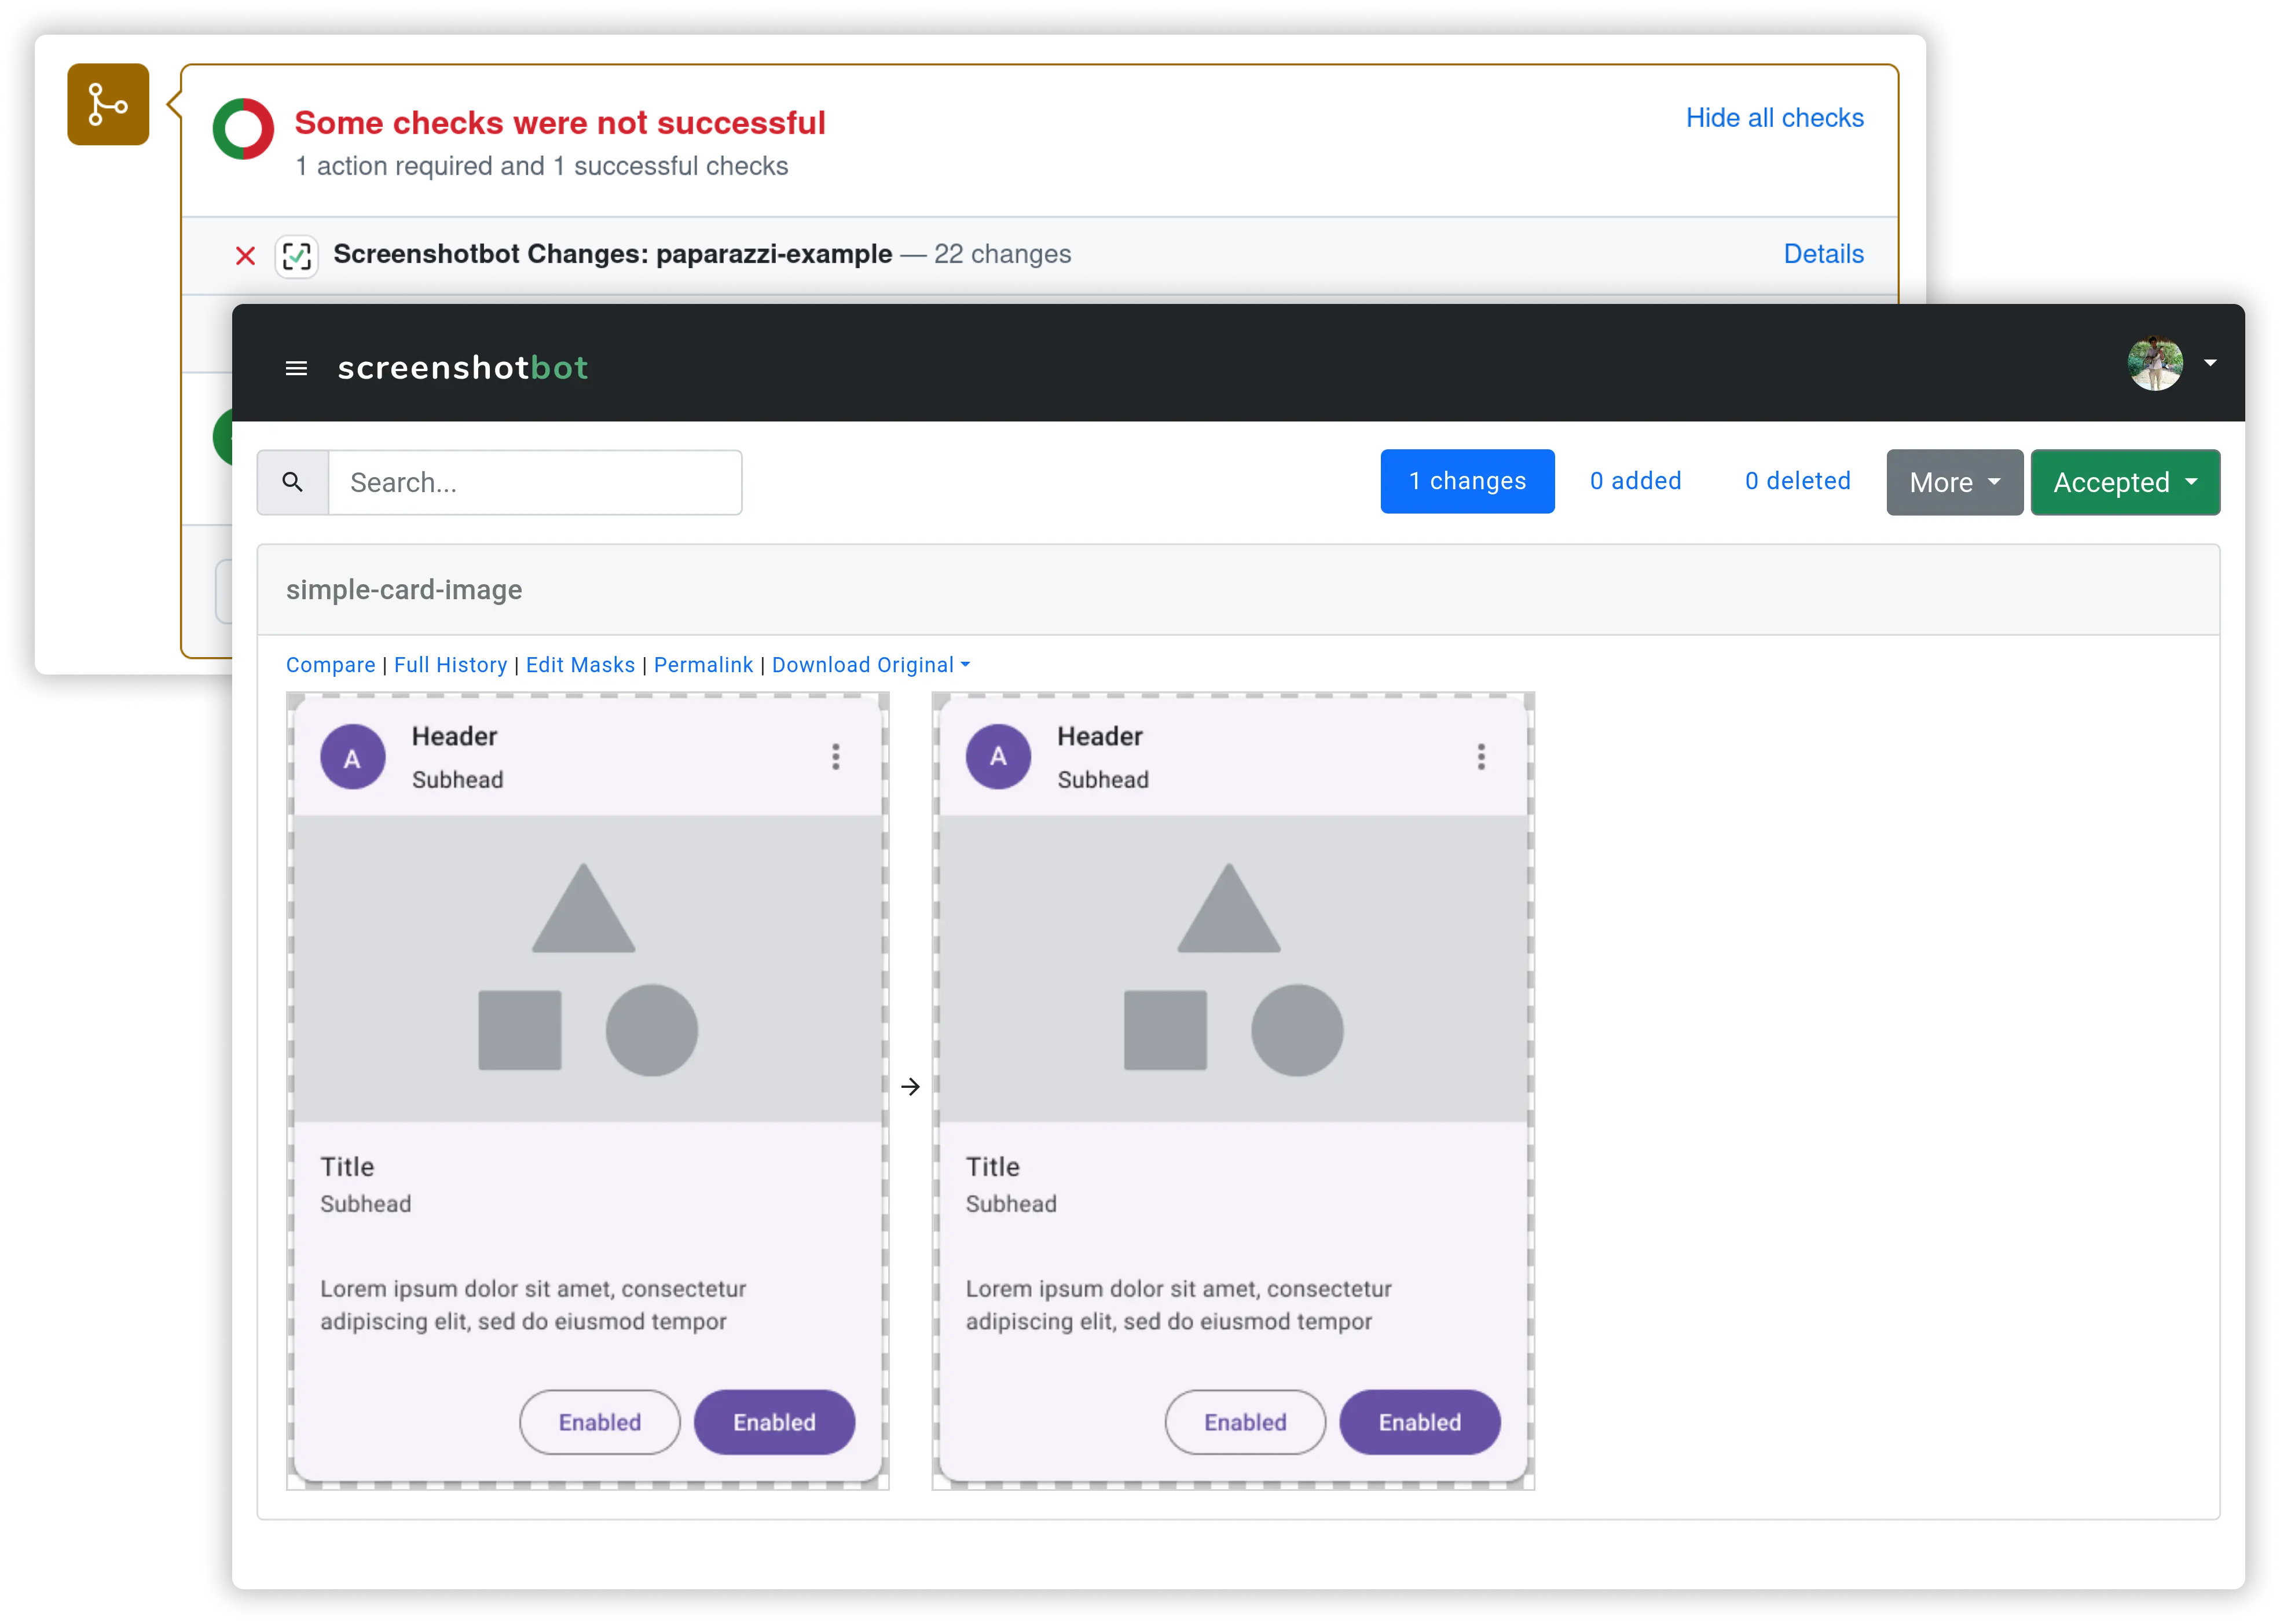
Use https://screenshotbot.io/tidyfirst to signup to get 20% off your first year.
Starting
One way to add value to a programming project is by starting things. There’s a need. A bunch of folks see it. Then someone does something about it. That moment of initiation is valuable.
We will take file creation as indicative of initiation. It’s not a perfect measure, but maybe it will work kinda sorta. We would expect (I would expect & I hope you come to expect) initiation to be Pareto distributed. People in the habit of starting things will have that habit reinforced.
So, to get to the data, how is file creation distributed among contributors to React?

Looks pretty Pareto to me. Lots of programmers only create one file. A handful of programmers create hundreds or thousands of files.
Change
If creating files was all one needed to do to be credited with influence, then we’d all write scripts that created tons of files & then we’d all be credited with outsized influence. Which would cause “influence inflation” & then nobody would get credit.
One way to develop a fuller picture of influence is to take into account how many times a file is changed. In the Empirical Software Design world we would say that each file embeds options. A change of its behavior is the exercise of one of those options. Tidying, changing a file structurally, creates new options. Both cases create value.
We (I, but maybe we) again expect changes to be Pareto distributed. Change attracts change. It’s a reinforcing loop. Again, data from React:
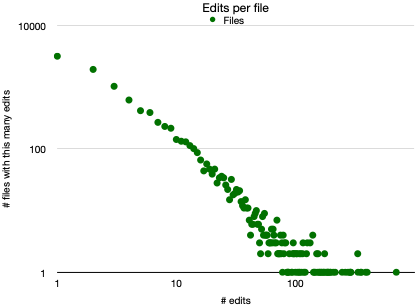
Hello, Mr. Pareto! Lots of files changed once. A few changed hundreds of times.
Influence
Take your time absorbing the graphs above. Get an intuition of what they mean & what they imply. This is the second time I’ve done this analysis (the first was at Facebook—dang I miss all that data). I’ve had to remind myself & re-remind myself of what the axes mean, what the dots represent, & what I might conclude from the patterns.
Okay, let’s put the two sources of data together. Remember, we’re trying to identify people with substantial influence. First influence was based on initiating change as evidenced by creating files. But what about those files out on the tail of the above distribution? Shouldn’t you get more credit if you create one of those much-changed files than if you create 100 files that never change?
Here’s a way to identify candidates who not only start things, but they start things that other people go on to modify—we’ll graph all the programmers:
One dimension is the count of files they create.
The other dimension is the number of times those files were changed. Refining that second dimension, we will only count changes by someone other than the original author.
(We’re not so interested in folks who go off into a corner to make something that only they refine ← note this is a policy choice that could easily go the other way.)
Here’s that data for React:

The first thing I notice is that there’s a clear trend line. Programmers who create more files tend to accumulate more changes to those files.
That upper right quadrant is where we expect to find influence, as seen through this tiny little data keyhole. Below the trend line are folks who create more files but those files attract fewer edits. Above the trend line are folks whose large numbers of files attract disproportionately large numbers of edits.
Good, Bad & Ugly
Some good (productive, not easily perverted) uses of the above data:
Finding where you stand with respect to your peers.
If you want to have more influence (which will end up being reflected in changes in the data), who should you ask for mentorship? (Note the order—you’re not trying to move up & to the right, you’re trying to be more influential which will naturally result in you moving up & to the right.)
Identify folks who have less structural power than their actual impact would warrant & give them more power.
Dig into outliers. Who is that one person who created one file that was changed a hundred times? What is it about that file?
Some bad (unproductive, unlikely to result in the desired macro changes, likely to poison the data for all future uses) uses of this data:
Bonuses.
Quotas.
Promotions.
Firing.
Some ugliness in this data:
Legibility. There are so many ways to have impact in software development that can’t be captured by numbers. Don’t incentivize people to abandon less legible contribution for a mono-maniacal focus on these numbers.
One scenario is that A creates a file, maybe grows it to be uncomfortably big, then along comes B & extracts it into several files (for which they get “credit” in the sense of their behavior altering the graph). One of those files will attract most of the changes, “credit” (again in this limited sense) will accrue to the refactorer, not the original author.
Hysteresis. People who have been on a project for a long time will naturally move up & right. Maybe have some decay function so we can ask, “What have you done for me lately?”
Conclusion
If you’re someone who decides about bonuses, promotion, & firing, then good. Someone has to do that job. It’s inevitably messy, biased, only ever moderately accurate. In other words, human. Don’t, whatever else you do, blame your decisions on the data. If you do you’ll never get accurate data ever again.
If you’re someone who want to improve their own development effectiveness, by all means interpret this data in ways that helps you focus. But always keep in mind the actual goal—impact—which is merely hinted at by numbers such as those above.
In both cases, don’t rely on my analysis. You have your own teams with their own context. Find critical questions, identify data & analyses that might shed light on those questions.
And always check your work. An earlier version of the scripts returned wildly inconsistent data. I’m glad I double checked. Data programming is programming too.
The scripts producing the above data can be found here.
How do we differentiate between the edits that were made to
1. fix something that was not working
versus
2. edits that were made to add functionality?
I guess more edits of type 1 would mean that the code had a lot of issues in the first place, which does not imply influence.
Type 2 implies influence - I agree.
I found an interesting failure mode already: one person creates a whole bunch of "golden master" / snapshot system tests, where the expected outputs are all in their own files. At least one of these tests fails every time any code is changed, forcing the programmer who made the change to update the snapshot. Et voila, the creator of the tests gets credited with "influence."