Anatomy of Oscillation

I was at first astonished, then angered, then resigned when I saw smart people calling for the return of waterfall thinking. I’ve since started to do something about it (Forest & Desert), but I also got to thinking about the anatomy of oscillation. How is it that systems swing between extremes.
Thermostat
The classic example of oscillation is the thermostat problem. You feel cold so you set the thermostat higher. You still feel cold so you set the thermostat even higher. Then you feel too warm so you set the thermostat lower. You still feel too warm so you set the thermostat even lower. And back and forth.

Here’s how the system is supposed to work:

Instead, because there is a delay in the link between changing the thermostat & changing the feeling of warmth, you end up with oscillation. I didn’t have a notation for “delay”, so I invented one:

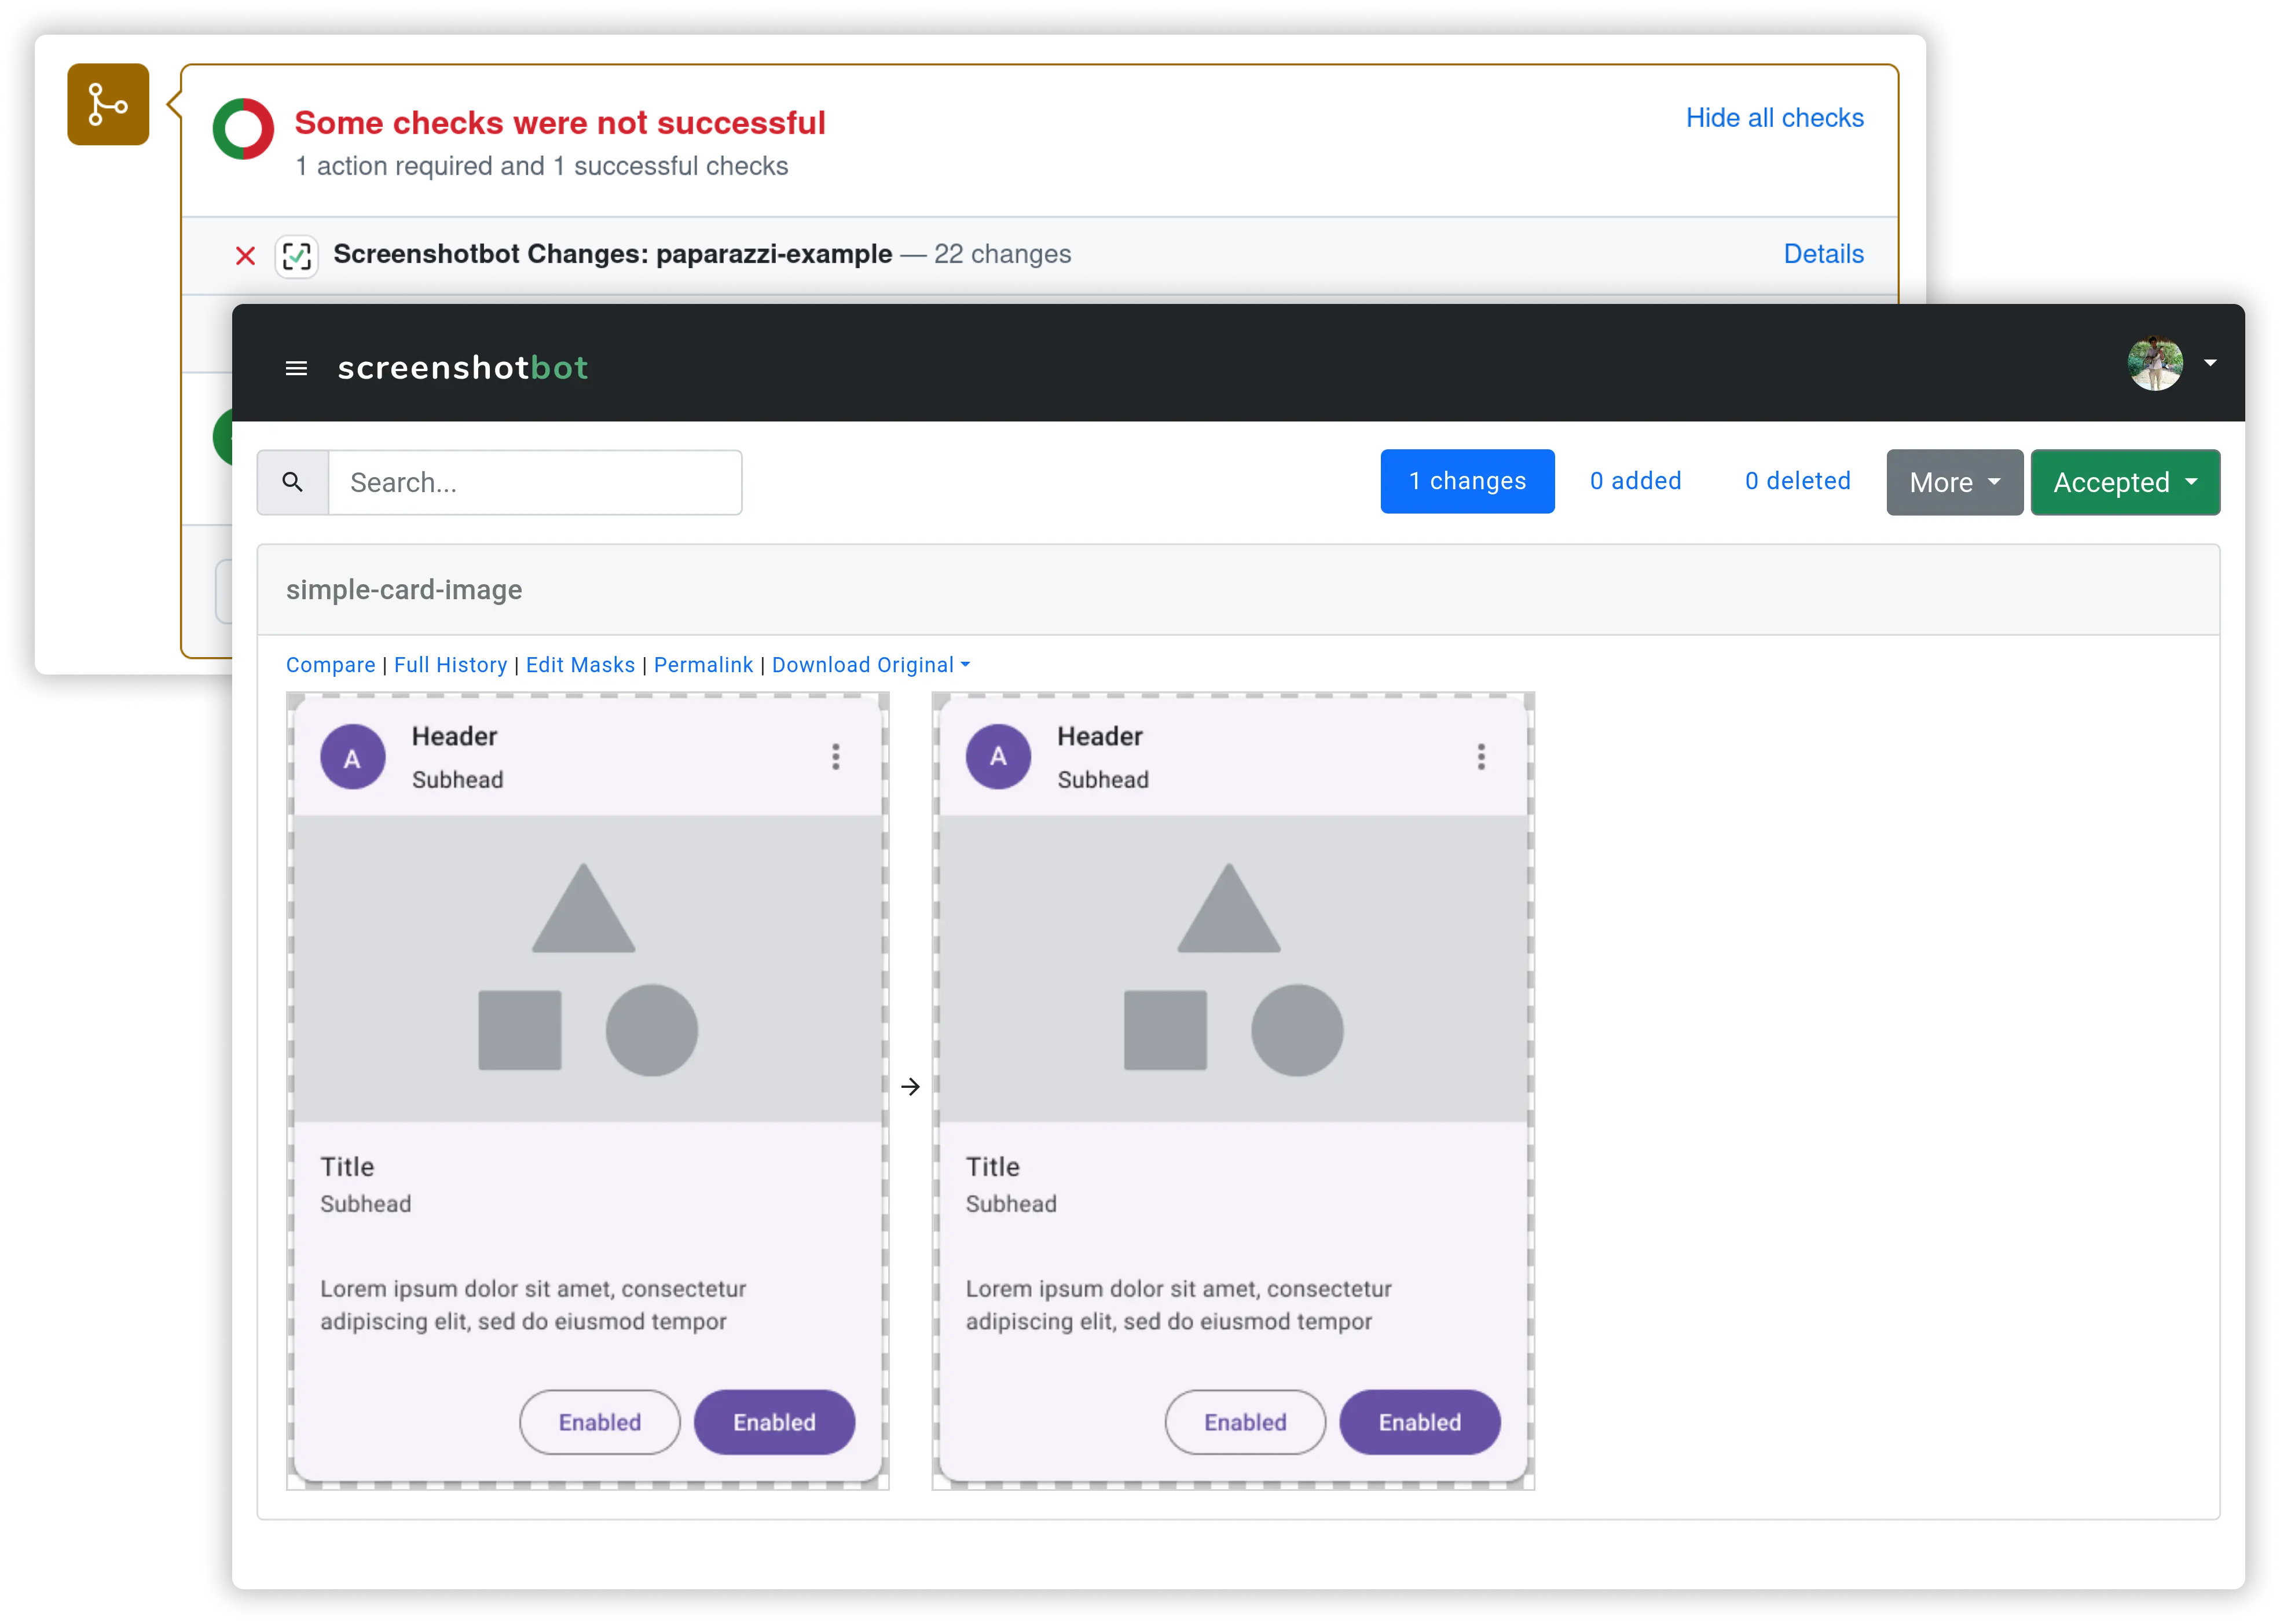
Thanks to this week’s sponsor, Screenshot Bot. Arnold Noronha, the founder, was a student of mine at Facebook.
Screenshot tests for mobile apps (and more)
Want to know when something has accidentally changed in your mobile app? Screenshot tests occupy a unique point in the space of tests—easy to write, predictive, & automated.
Use https://screenshotbot.io/tidyfirst to signup to get 20% off your first year.
Predator/Prey
We can apply the same pattern & notation to another classic oscillation—rabbit & hawk populations. More rabbits means that more hawks survive to hunt which leads to the rabbit population collapsing which leads to hawks starving which leads to more rabbits.

However, it takes a while for an increase in rabbits to lead to an increase in hawks (at least one breeding season), so we get oscillation.

Schemas
Some work on systems theory makes a big deal about these kinds of generalized schemas—A leads to more B with a delay, more B leads to less A, therefore you’ll get oscillation. Bertalanffy & Meadows both catalog these kinds of general patterns.
I’ve never found such schemas helpful in practice. I just follow the influences around & try interventions that make sense. However, I wonder if the schema will help me understand reactionary waterfallism.
Documentation
Take the case of documentation. I’m seeing more calls for comprehensive documentation from programmers.
In The Forest (more specifically on an XP-style team), we handle communication of design & implementation multiple ways:
Communicative code.
Readable & predictive tests.
A strong social network.
It’s only when there is a large audience for stable information (such as the JUnit API) that we resort to separate documentation.
Here’s how it’s supposed to work:

As we maintain code we have questions. The documentation provides answers. That gives us the motivation to write more documentation.
However, much of the information about a system decays. Reading out-of-date documentation is at least a waste of time & sometimes actively misleading:

This lead me & others to seek alternatives to documentation. As the Agile Manifesto put it, “Working software over comprehensive documentation”.

But, and here is where the schema above kicks in, we don’t notice documentation decay for a while:

So “of course” we are going to oscillate around too much & not enough documentation. Especially since development in The Desert don’t supply enough of the alternatives to documentation listed above—communicative code, readable tests, & a stable & generous social network.
Models
Ironically, these calls for more documentation come just when GenAI is getting good at providing answers to questions about software. If we can ask a model about the state of things today & how they got that way, then we don’t need to carry around a document written by years-ago me that might or might not still be valid.

If you’re determined to write documentation, by all means go ahead. Maybe include analytics, though, to see how often it is read & how often readers find it helpful. If those analytics show that the documentation turns out not to be valuable, consider not writing it in the future.
By the way there is yet another way to represent time delays, from discrete control system theory, which is a z^(-k) block where k is the number of sampling periods the signal is delayed.
'reactionary waterfallism' is such a wonderful phrase!